R and Rcmdr crashcourse for statistics
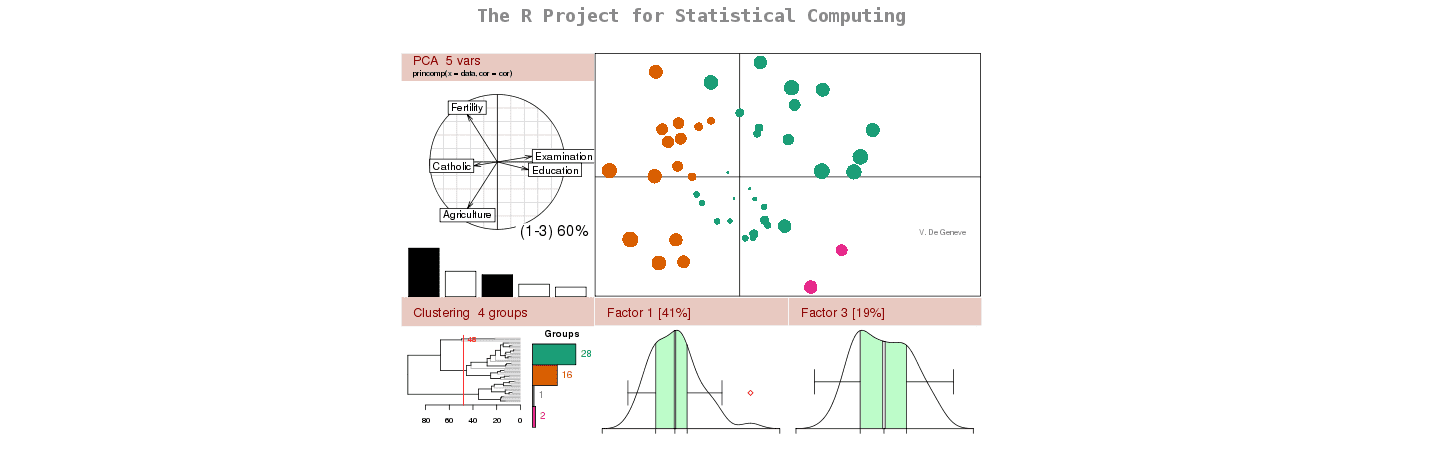
R is a complete and complex computer language with a broad view of data analysis. It is similar to the S language and environment which was developed at Bell Laboratories. Check the project’s website for more info.
It is, to some extent, possible to bypass its steep learning curve, through substituting deep R knowledge by an easy to use interface. R is then limited by the interface and loses a lot of it’s intricate power, but becomes a great and easy to use statistic tool. This article tends to be that shortcut.
First of all, R is free software (Open Source), available on *nix, windows and OSX. To download it go on the project’s mirror list – and download it from the mirror nearest to your location. (*nix users, R is probably available in your package manager). Follow typical installation steps.
Please note that R is case sensitive, a is not A and b is not B ! this is particularly important when you type commands!!!
Once R is installed we should launch it, start R – you should get something like:
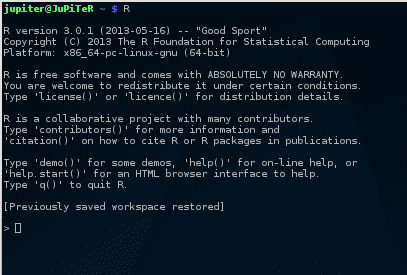
Well done, you are now in the R command line interface (CLI), now let’s install “Rcmdr” – The graphical user interface (GUI) that we will use for this article.
type the following command in the CLI:
install.packages("Rcmdr",dependencies=TRUE)mkdir ~/.tmpdir && export TMPDIR=~/.tmpdirThen rerun previous command.
You will then be asked to choose a CRAN mirror: just take to nearest to your location 😉
Once this is done, R should work a bit, installing all required packages. If no errors occurred, you can now run Rcmdr :library(Rcmdr) A windows should popup: welcome to Rcmdr. Let’s take a look at this windows: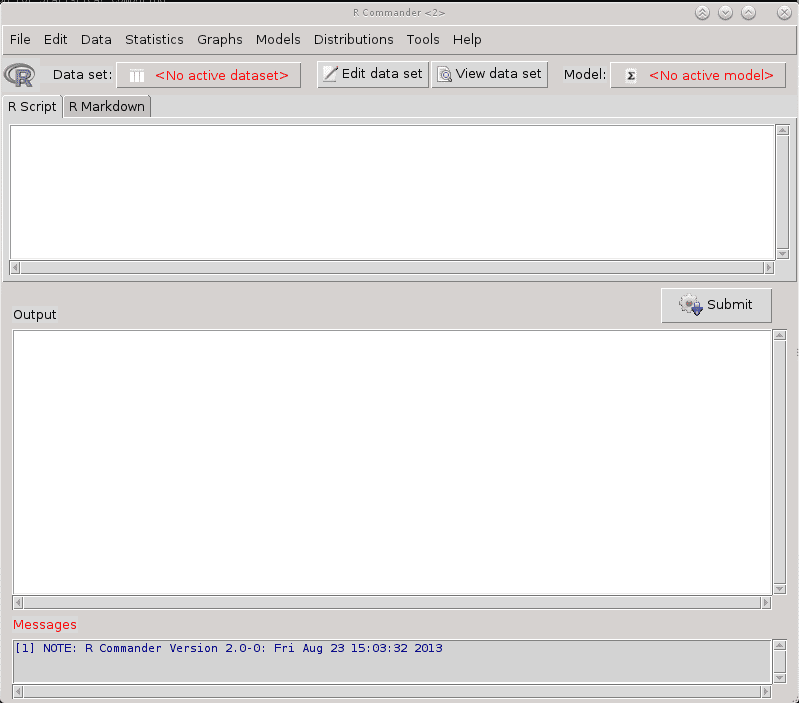
The top menu contains all the functions we will need, below it, we have the dataset management. The rscript will post the R commands corresponding to the menus above, we will not use the R markdown part. The output part is where our answers will be displayed, and the messages are mostly useful in case of errors.
The first thing to do is feed Rcmdr a dataset to work with. You can connect R to a database directly, however in this example, we will work trough a CSV file. We will consider the common case where you receive an excel file and convert it properly. This is a crucial step, as you must be certain your data is well formatted.
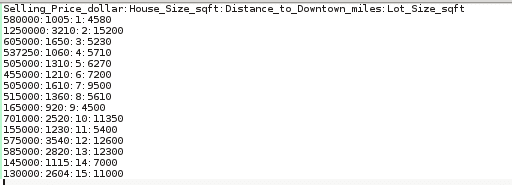
First, download the following excel file: example data – and open it with a spreadsheet program.
The “export” or “save as” the file as a CSV file. The character set should be set to UTF, and be carefull of the field separator you use. Indeed, if your data contains commas and you use the comma as a field separator, then your import will fail. So lets choose the semicolon as data separator and export.
Now open the csv file with a text editor (notepad for example), the file is still not “clean”.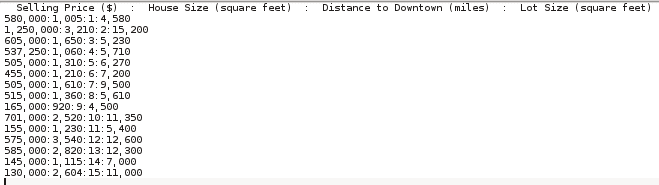
To clean it:
- Clean the titles – no (), no $
- Remove all commas and spaces (use replace all function and replace by nothing)
Now that the file is clean, lets go back to Rcmdr to import it.
Click on data – Import data – From text file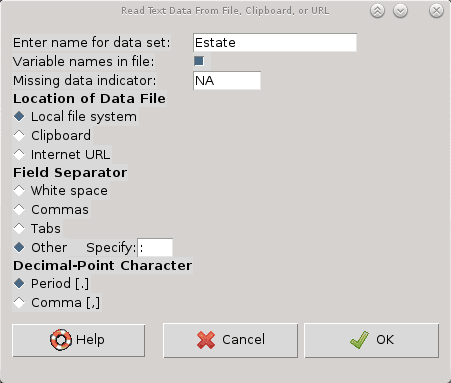
We will name the dataset “Estate”, the variable names are in the file, the file is on our filesystem, the Field separator is other : – and decimal point character is . Click OK, then select the csv. Our dataset is loaded in R.
Now all there is to do is ask R to calculate what we want to know: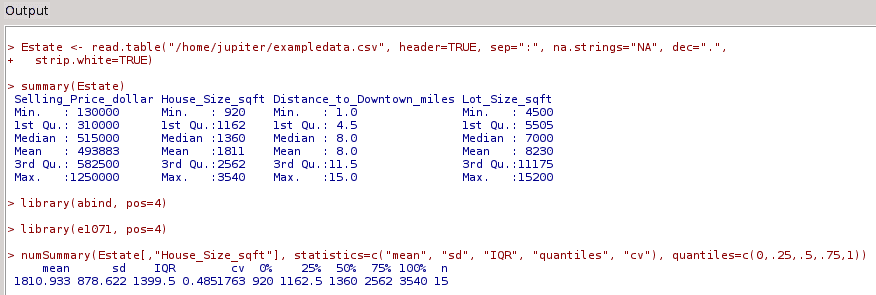
Note that the lines in red are the R commands. You would have the same result if you typed them in the R CLI (steep learning curve).
- - Statistics – Summaries – Active data set. Gives you the min/max 1st and 3d quartile, mean and median
- - Statistics – Summaries – Numerical Summaries. Gives you mean, stdev, interquartile range, coefficient of variation, skewness of chosen variables
- - Statistics – Summaries – Correlation test. Runs a correlation test on two variables.
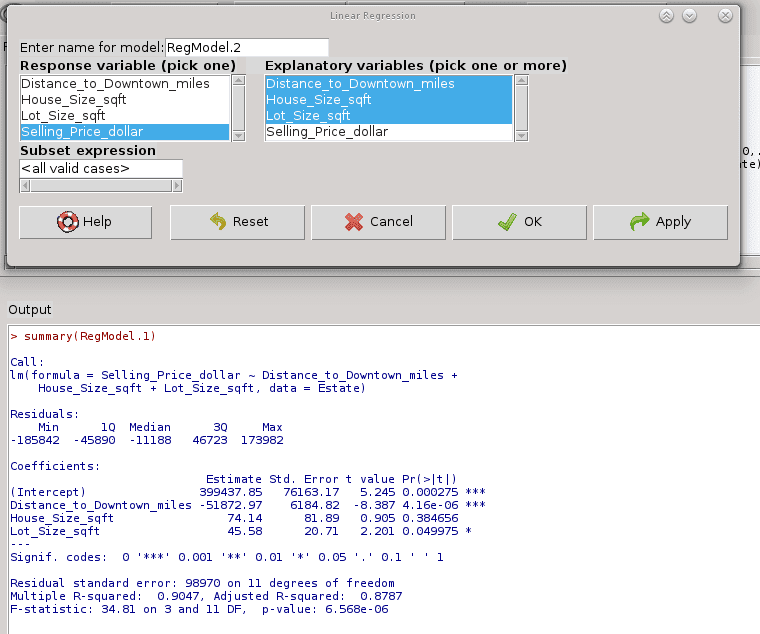
- - Statistic – Fit Models – Linear Regression. Does what it says: Intercept, slopes, P value, residuals, adjusted R², …
- - Models – Confidence intervals.
- - Models – Hypothesis testing – ANOVA table
- - Graphs – Histogram
- - Graph – 3D – 2D scatterplot
- - …Many many more…
R is a fantastic language and Rcmdr allows to bypass R’s steep learning curve, making it easy to use, powerful, tool.
If you would like to go further in the R language, Rstudio is a powerful IDE for R.